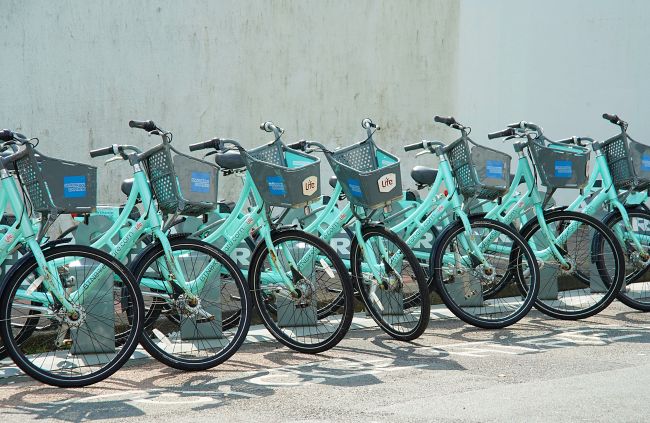
Steer launches new ‘data storytelling web app’ to explore the impacts of the pandemic on the US micromobility market
Steer developed an app to explore the impacts of the pandemic on micromobility over time.

As the COVID-19 pandemic adds increasing pressure and severe disruptions to the fast-changing and growing micromobility industry, how can we better monitor the developments?
Steer developed the app to explore the impacts of the pandemic on micromobility over time and to use the findings to help guide policy and decision-making for our clients, whether they are in the public or private sector.
What is it?
The Steer ‘Micromobility data storytelling app’ is a web-based solution to help analyze how COVID-19 affects bike share utilization in six cities around the United States, as well as how this will affect how cities pivot to the “new normal”. Learn more about the study and its key findings.
How was the app developed?
The biggest undertaking of the project was collating and processing the data. The first part of this involved researching data sources, which led to six US cities being identified as providing historic bike share data suitable for our use. Using Postgres and NodeJS, a toolkit was developed that automated many of the data processes, including downloading, transforming, importing, normalizing and aggregating the data. Overall, 60 million trips were processed across them.
The metrics that were explored were the total trips, average trip duration, trip distribution over the day and most popular stations for each city over the given time period. This was done by setting up a series of SQL queries that were exported to JSON.
The final output developed was a data storytelling web presentation, which is a structured approach for communicating data insights and involves a combination of visuals and narrative presented in a linear fashion, much like a story with an introduction, sections and conclusion. The story app was built with Svelte, ChartJS and Mapbox, driven by the metrics data (JSON).
Challenges we overcome
- Understanding and formatting the various sizes and types of data provided by the suppliers - 14 different data formats from six cities.
- Automation scripts were created to aid the process of obtaining and processing all the data for 2019, 2020, and 2021 – previously, this would have required manually downloading and processing hundreds of files.
- A number of issues had to be addressed during data normalization, including inconsistencies in date formats and the separation of date and time elements.
How can it benefit your organisation?
- Better analysis: our tool helps our client to analyze large sets of data more efficiently, exploring unseen patterns for specific areas of focus
- Making sense of big data: Handling large amounts of data in an efficient visual format to provide a summary of new trends, revealing insights to help decision-makers
- Efficient decision-making: our tool can help decision-makers from the public and private sectors to understand how data can be presented and interpreted to determine strategic decisions based on the latest trends
- Exploring the latest new mobility trends: navigating through the most recent datasets to enhance knowledge on the most recent new mobility trends and unearth opportunities
Why did Steer develop the tool?
- Planning for recovery: the development of this tool is part of Steer’s strategy to support and assess the short and long-term social and economic impacts of the Covid-19 pandemic on micromobility behaviour change.
- Monitoring and analyzing: the changes of use in the micromobility sector in the US in the long-term.
- Impact of the pandemic on travel: the new mobility team wanted to explore trends in micromobililty and see how travel patterns had changed.
Please get in touch with a member of our New Mobility team if you would like more information or to see a more detailed demonstration of the tool.


